Herdify Demographics
The demographics section in the Herdify insights page shows a list of your brand's over-represented Mosaic Groups in Herdify areas.
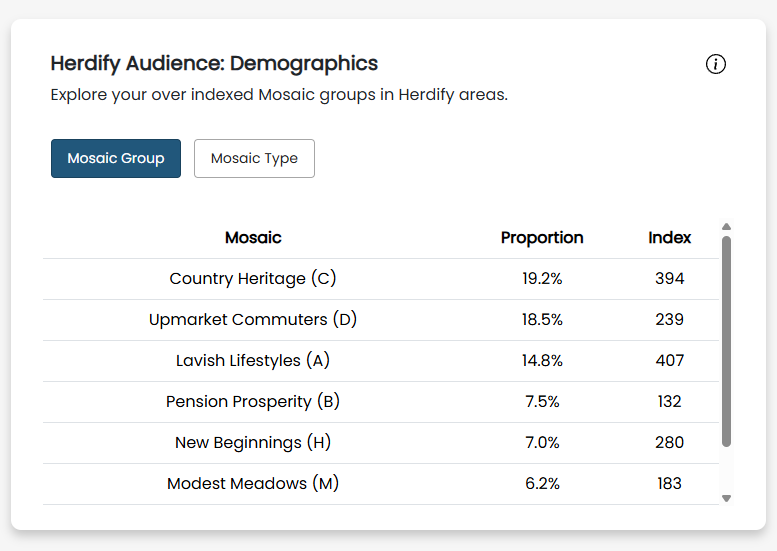
For each Mosaic Group, you can see the proportion of your customer base who belong to it, as well as the index compared to national averages.
Use the buttons available to toggle between Mosaic Groups and Mosaic Types.
Understanding indexes
Indexes give you an idea of how over or under-represented each Mosaic Group is compared to national averages.
For example:
- an index of 100 indicates the proportion of customers in a group matches the national average
- an index of 110 indicates the proportion of customers in a group is 10% higher than the national average
- an index of 200 indicates the proportion of customers in a group is 100% higher or twice the national average
- an index of 350 indicates the proportion of customers in a group is 250% or 3.5 times higher than the national average
Let's say 10% of your customers belong to Mosaic Group A - Lavish Lifestyles. Let's also assume that 5% of the population nationally belong to Mosaic Group A - Lavish Lifestyles.
Then Mosaic Group A - Lavish Lifestyles will have an index of 200. Your customers are twice as likely to belong to A - Lavish Lifestyles than a random member of the public would be.
For more information on Mosaic Groups and Types, see our guide to Mosaic 8 in the Herdify portal.