Audience discovery
Audience discovery compares how your brand performs in word-of-mouth areas against how it performs everywhere else within each Mosaic Group.
It will tell you which of the 18 Mosaic Groups word-of-mouth is adding value to, how much value it's adding per household, which groups are worth testing even if they don't rank near the top, and how much of each group sits in word-of-mouth areas.
The three metrics
Three tabs switch what the chart is measuring. Groups re-rank each time you switch, because a group that recruits fastest isn't always the one worth the most per customer.
- New customer rate - how quickly a group brings you new customers, per household.
- Lifetime value - what those new customers are worth once they've been recruited.
- New revenue - the two combined: how much new revenue a group generates per household.
Understanding the table
Each row is one of the 18 Mosaic Groups. These are ranked top to bottom by overall value for the metric you've selected.
The bar has two parts:
- Baseline (dark grey) - the group's value in its non word-of-mouth areas.
- Word-of-mouth (magenta) - the group's value in its word-of-mouth areas.
The lower value fills the bar first, and the higher one continues from where it ends.
- WoM lift - the bar ends in magenta. The group performs better in its word-of-mouth areas.
- WoM shortfall - the bar ends in dark grey. The group performs better outside its word-of-mouth areas.
- Equal - the bar is one colour. Word-of-mouth makes no difference to this group.
There are two vertical lines:
- The dark blue line marks 100, your organisation's average across all postcodes for the metric you've selected. It is not a national average - see what the index means for the full definition.
- The yellow line marks the WoM value of the group you've selected, shown across every row so you can compare it against every other group.
To the right of the bar are the two numbers behind it, a BASELINE index and a WOM index.
Selecting a group
Click a row (or select it with the keyboard) to open a panel with more detail on that group.
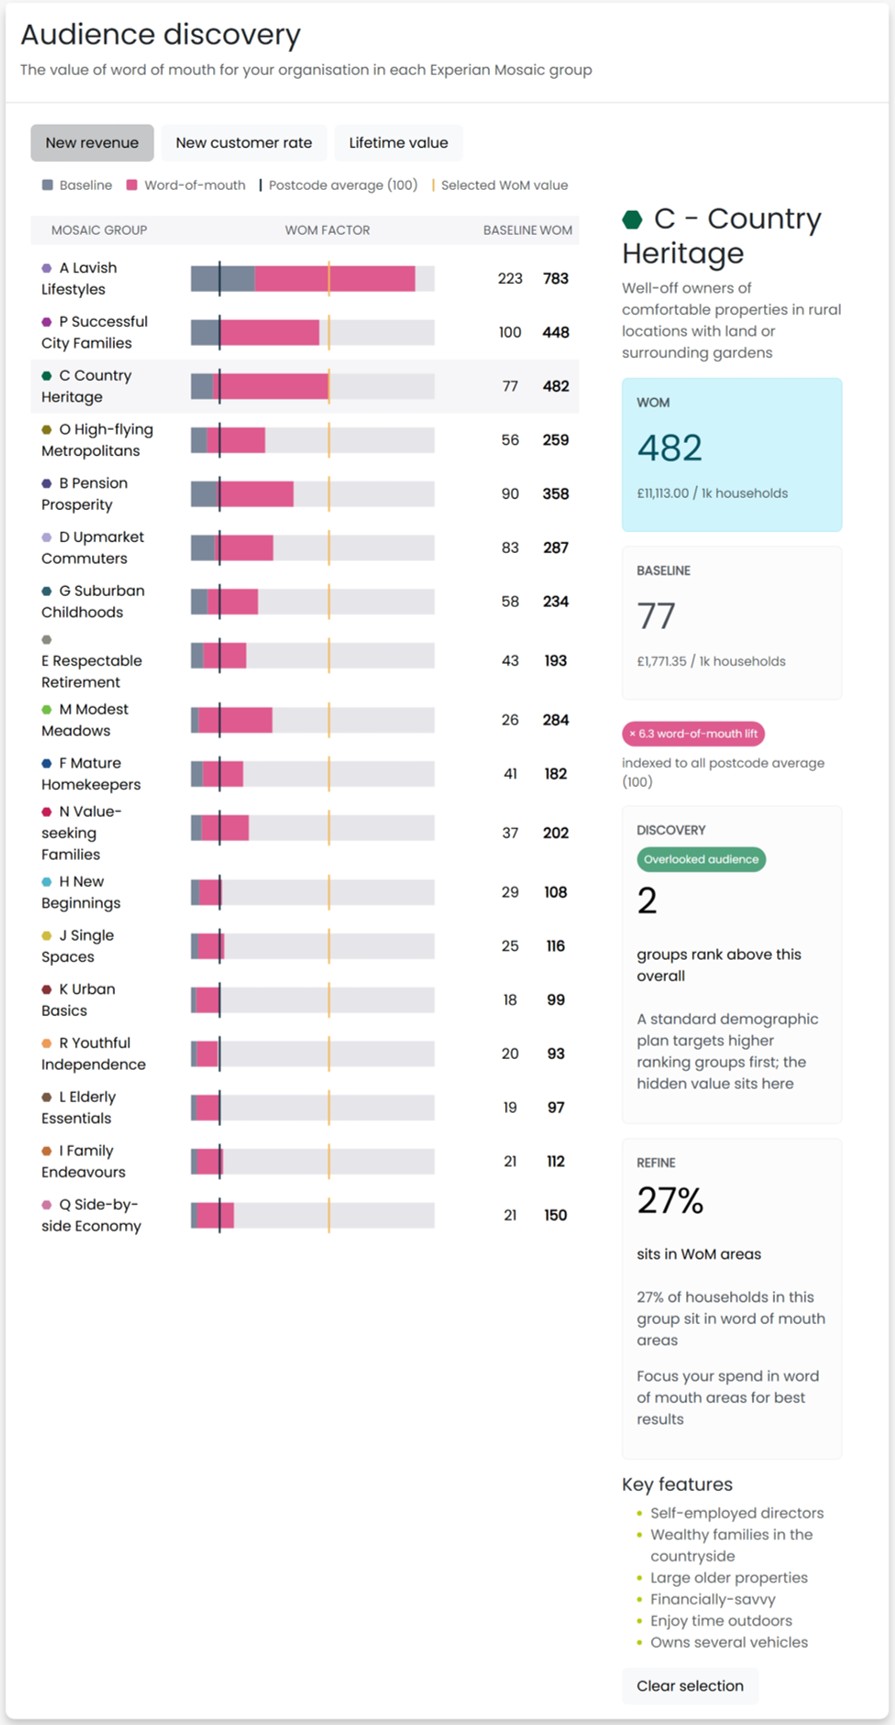
The panel shows:
- The Mosaic Group's description and key features - the kind of person who lives in these areas.
- BASELINE and WOM index - the two numbers side by side, so you can compare them directly.
- Lift badge - how many times higher (or lower) the word-of-mouth value is than the baseline.
- Discovery card - whether this group's word-of-mouth areas make it worth testing against groups ranked above it. See Finding and refining audiences.
- Refine card - what share of the group's households sit in word-of-mouth areas.
For how each figure on the panel is calculated, see the metrics and calculations reference.
Using the insights
Once you have read and understood the table you can use the insights to spot an overlooked audience, or a group worth refining, see Finding and refining audiences.