Audience Report
The Herdify Audience Report gives you the details about who lives in your audiences and how they spend.
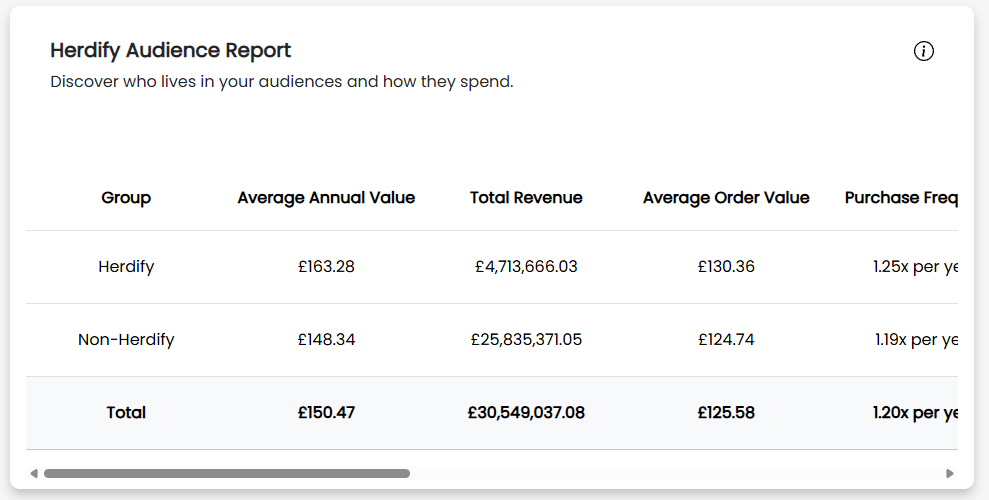
The report is broken down into three segments:
- Herdify areas
- Non-Herdify areas
- Overall
Audience Report Metrics
There are 10 metrics available for each segment. They are all calculated over the past year.
- Average annual value
- Total revenue
- Average order value
- Purchase frequency
- Number of transactions
- Number of unique customers
- Most dominant Mosaic Group
- Most over-indexed Mosaic Group
- Most dominant Mosaic Type
- Most over-indexed Mosaic Type
The most dominant Mosaic Group (or Type) is the one that the largest proportion of your brand's customers belong to.
The most over-indexed Mosaic Group (or Type) is the one where your brand's customers are most over-represented compared to the national average – in other words, where your customers make up a disproportionately large share relative to the general population.
For more information on Mosaic Groups and Types, see our guide to Mosaic 8 in the Herdify portal.
Example use cases
Customer value
- Compare Herdify and non-Herdify customers – If your Herdify areas show a higher average annual value or purchase frequency than non-Herdify areas, this suggests that word-of-mouth is driving higher-quality customers, not just more of them.
- Spot untapped potential – A lower average order value in Herdify areas might indicate an opportunity to upsell or cross-sell to an already-engaged audience.
Demographics
- Inform creative and media planning – If your most over-indexed Mosaic Group skews toward a particular lifestyle or life stage, use that insight to shape messaging, channel selection, or creative briefs.